Unlocking the Power of Real-time Insights: Exploring IBM Maximo Monitor
As we continue to push the boundaries of innovation in the reliability industry, it's exciting to see how technology is transforming the way we approach maintenance and asset management. In this blog, I'll be diving into the key features and functionalities of IBM Maximo Monitor, a game-changing application that's revolutionizing the way we collect, analyze, and act on IoT data.
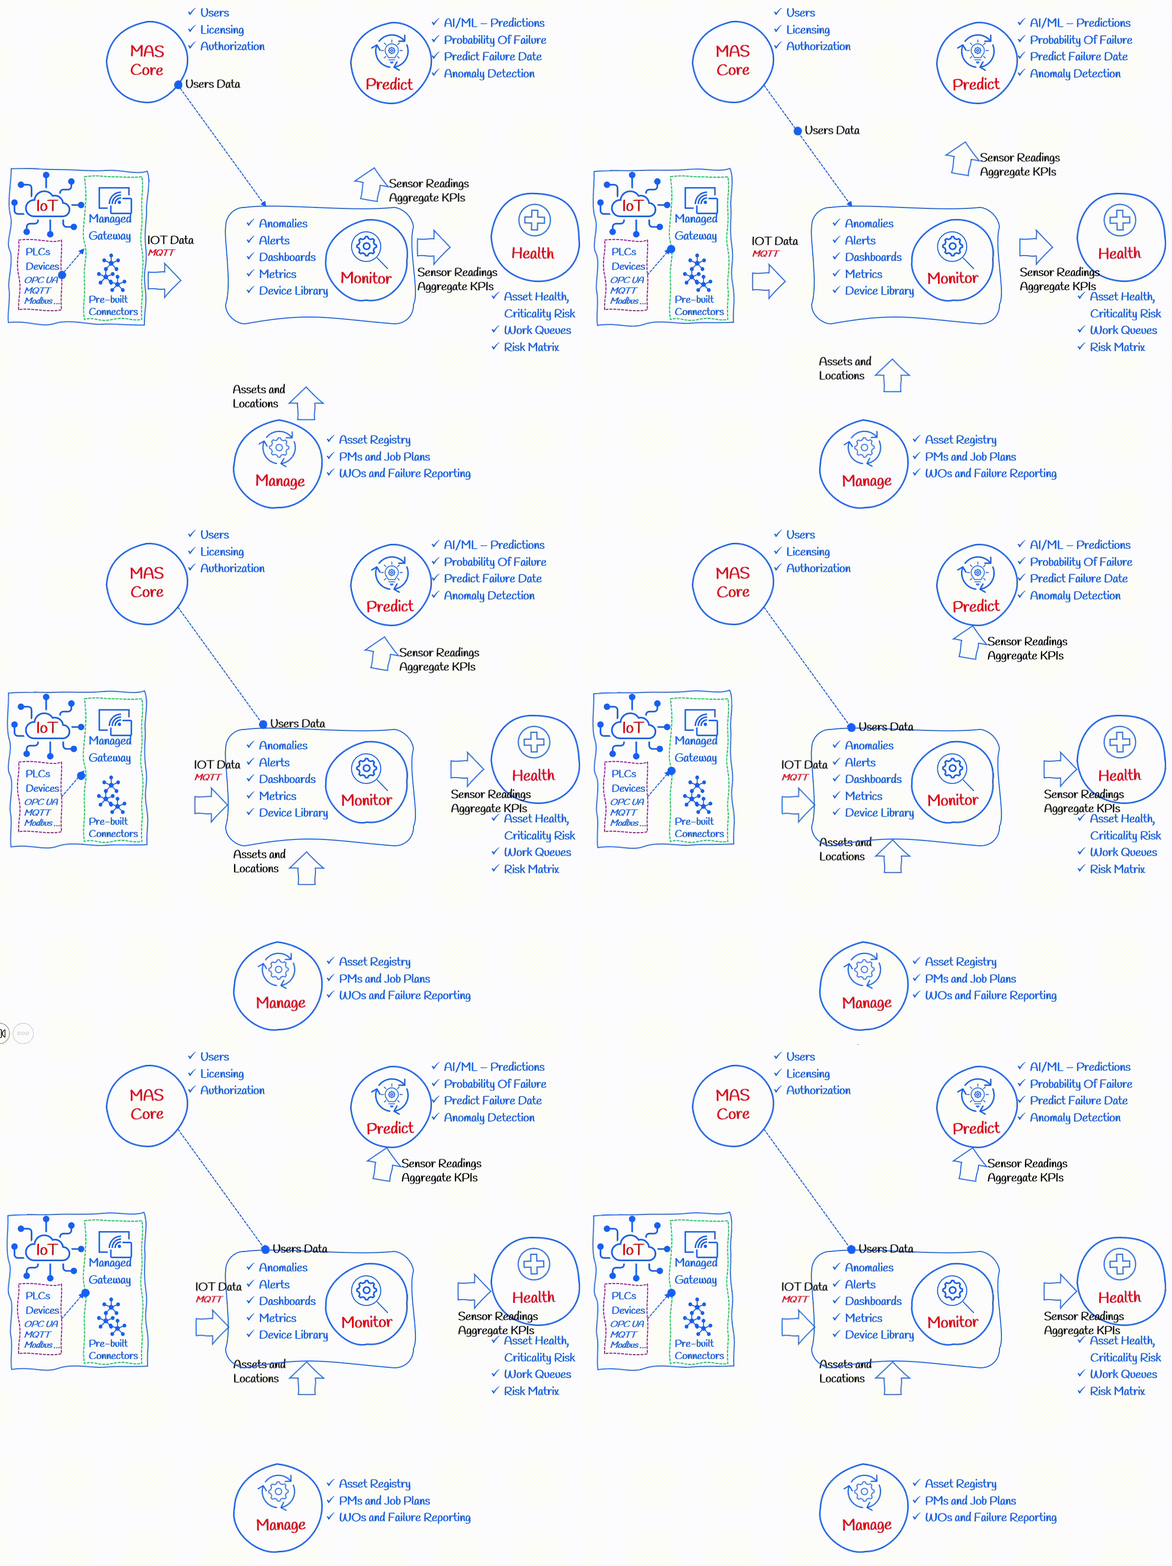
As we transition from interval-based preventive maintenance to data-driven predictive maintenance, the Maximo Application Suite offers a comprehensive and integrated set of tools that are designed to work seamlessly together. At the heart of this suite is Maximo Monitor, where we integrate and receive sensor readings at enterprise scale, create dashboards, alerts, and detect anomalies. Let's take a closer look at what makes Monitor so powerful.
Managed Gateway (Edge Data Collector):
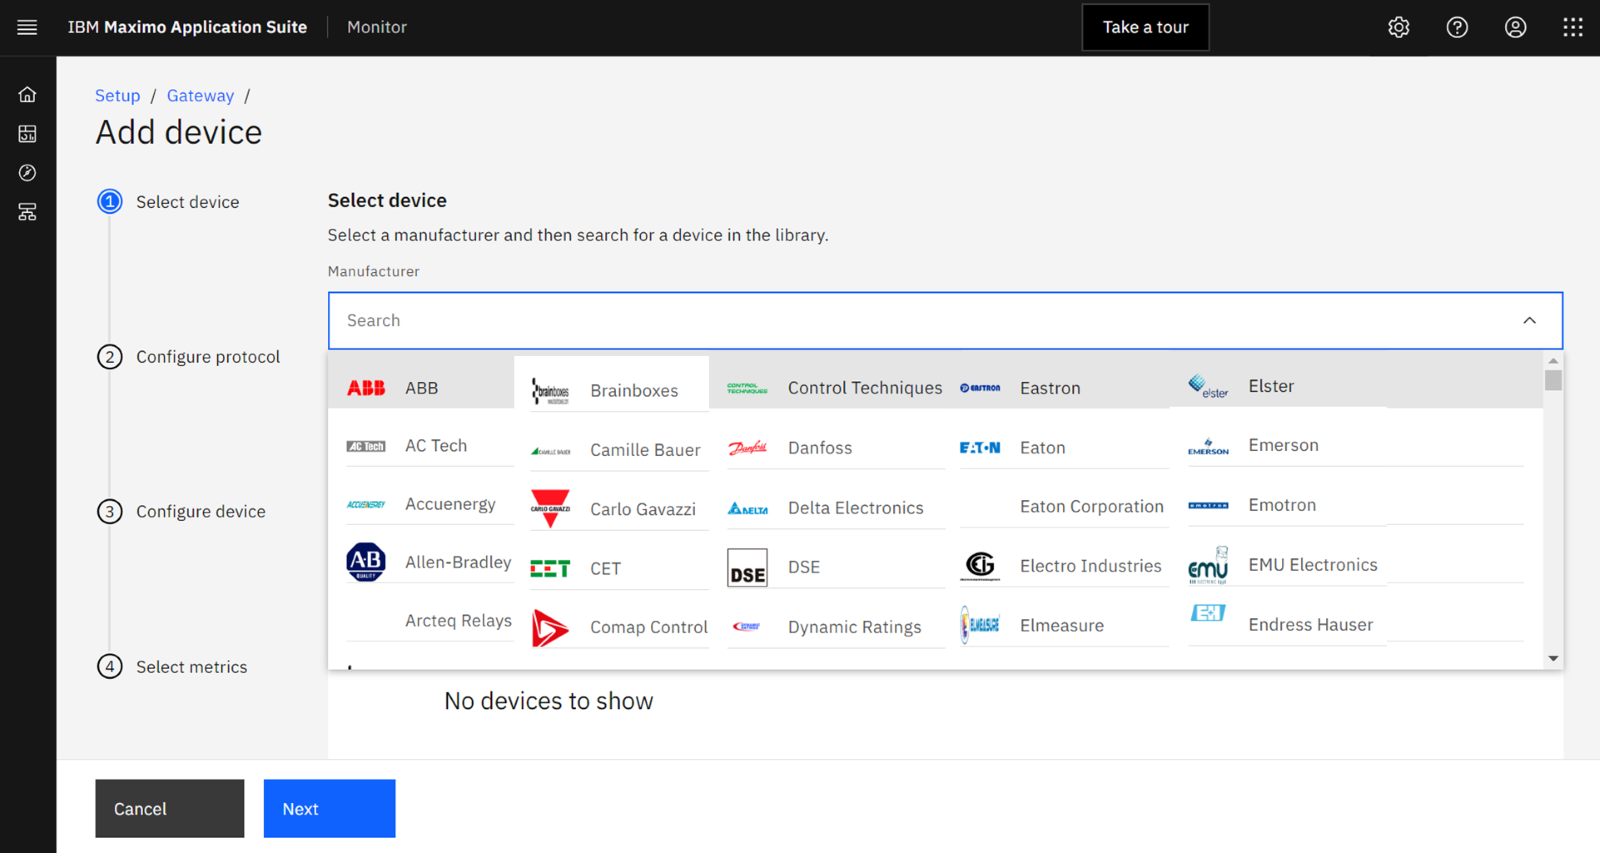
The Managed Gateway, also known as the Edge Data Collector, is a true game-changer for enterprises. This innovative technology connects and collects data from IoT devices with ease, scaling quickly to meet the needs of your entire organization. With pre-built connectors for a variety of devices and support for new devices available upon request, you can rest assured that your IoT data is always accessible and actionable.
Metrics and Derived Metrics:
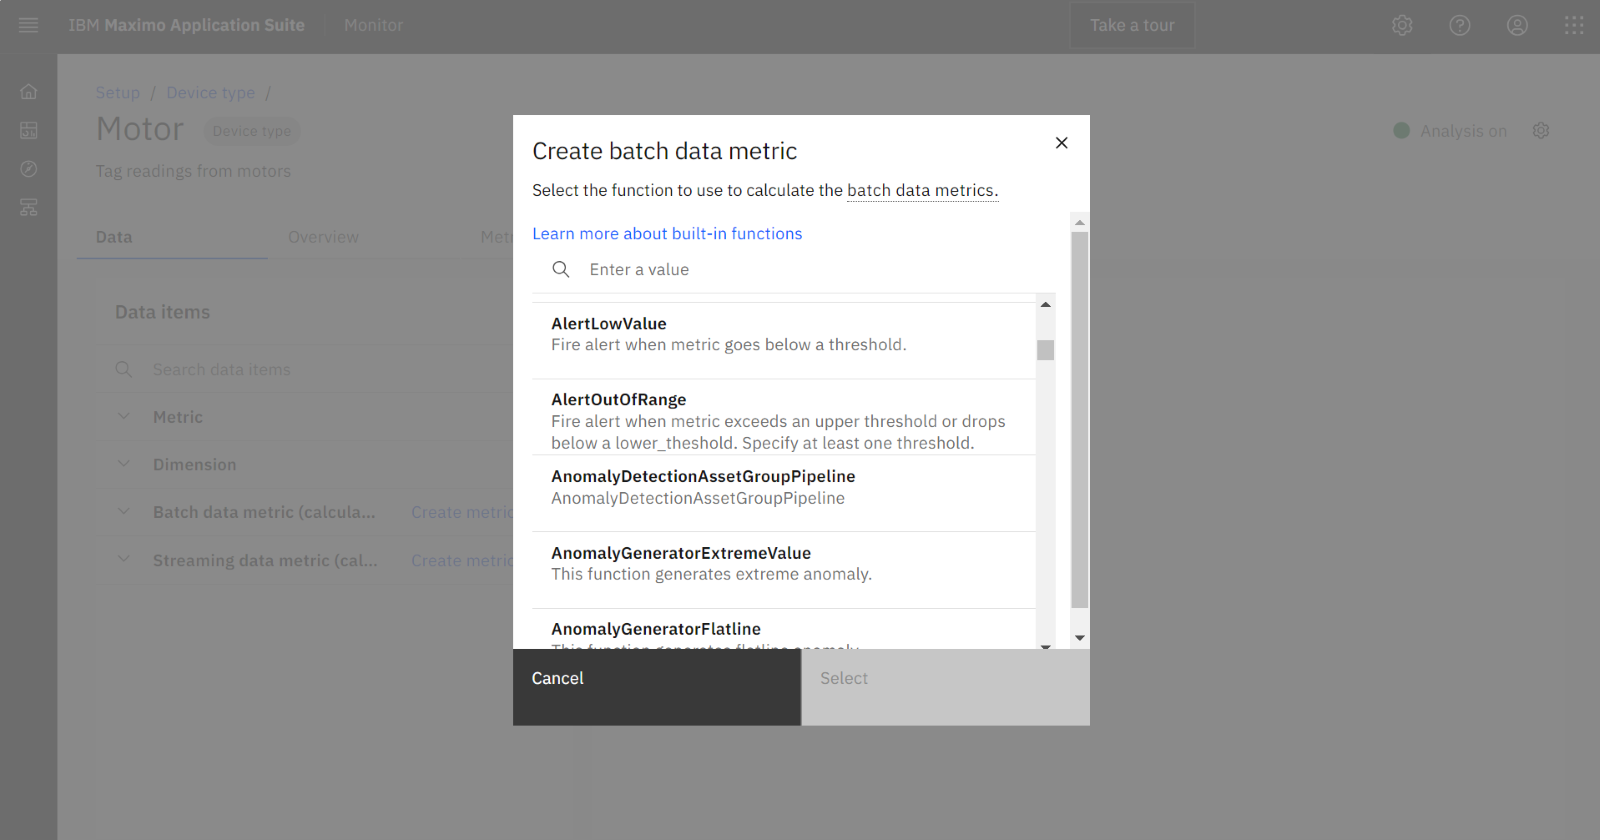
Raw data from IoT devices can be monitored in real-time on dashboards or converted into derived metrics that provide deeper insights. Monitor offers a vast collection of functions, including anomaly detection, alerts, aggregation, time-in-state, and more. Plus, with the ability to write custom Python functions, you can tailor your data analysis to meet your specific needs.
Alerts and Dashboards
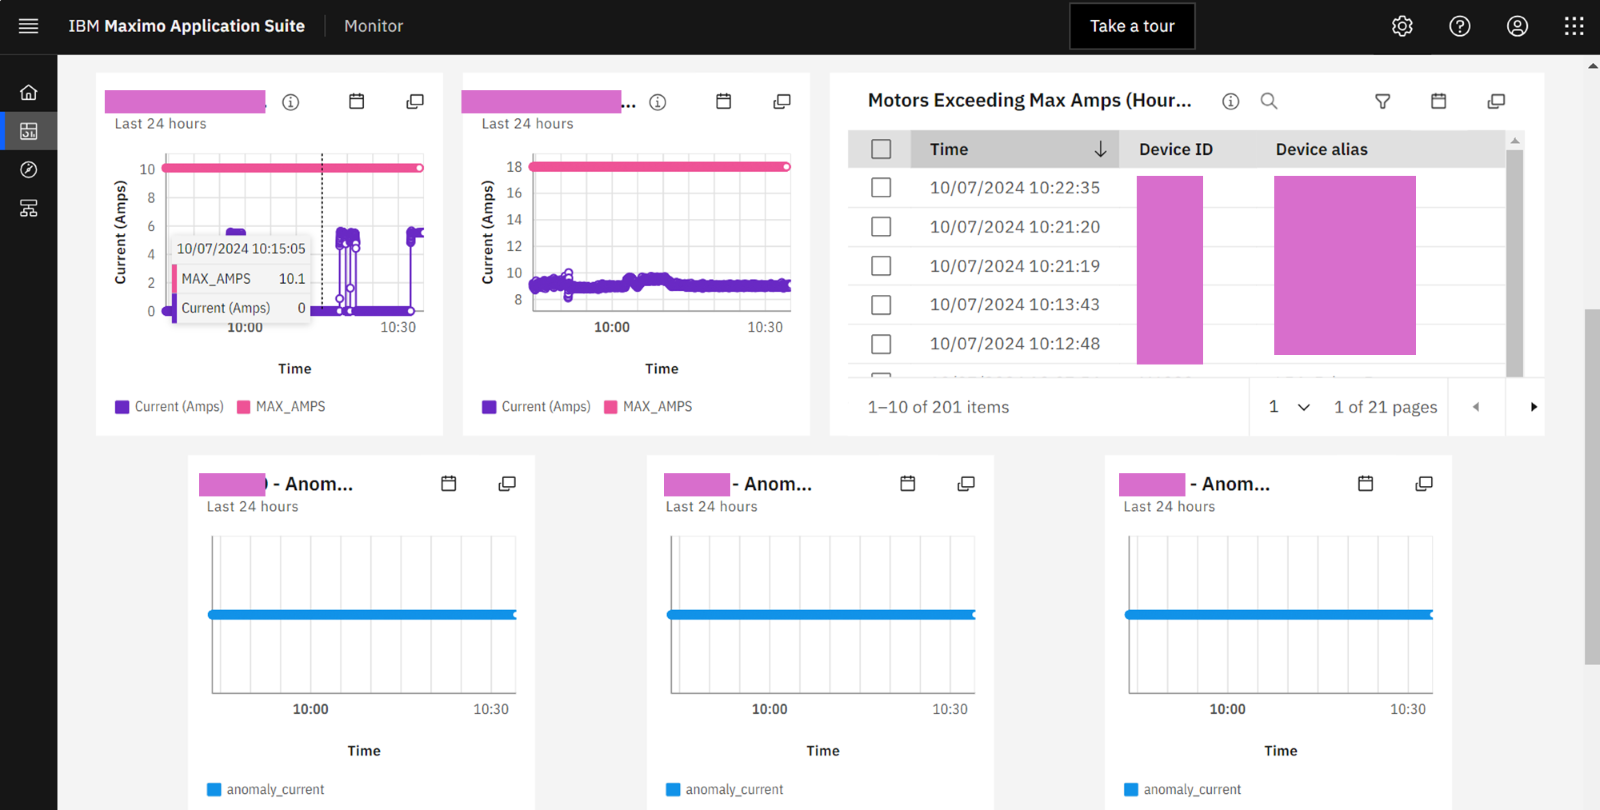
With Monitor, you can create dashboards that bring your data to life, using alerts from sensor readings and derived metrics to identify anomalies and trends. This real-time visibility enables you to make informed decisions, respond quickly to issues, and optimize your maintenance strategies.
Seamless Integrations with Other MAS Applications:
MAS Monitor seamlessly integrates with other applications in the suite to provide a comprehensive reliability centered maintenance solution to users.
- Manage:
Monitor gets Asset and Locations Hierarchy from Manage. IOT devices are attached to the assets and dashboards can be created at these hierarchy levels.
Sensor readings and derived metrics are sent to Manage from Monitor as Manage “Meter Readings”.
- Predict:
Metrics and Derived metrics are available for MAS Predict Machine Learning Models to train on.
- Health:
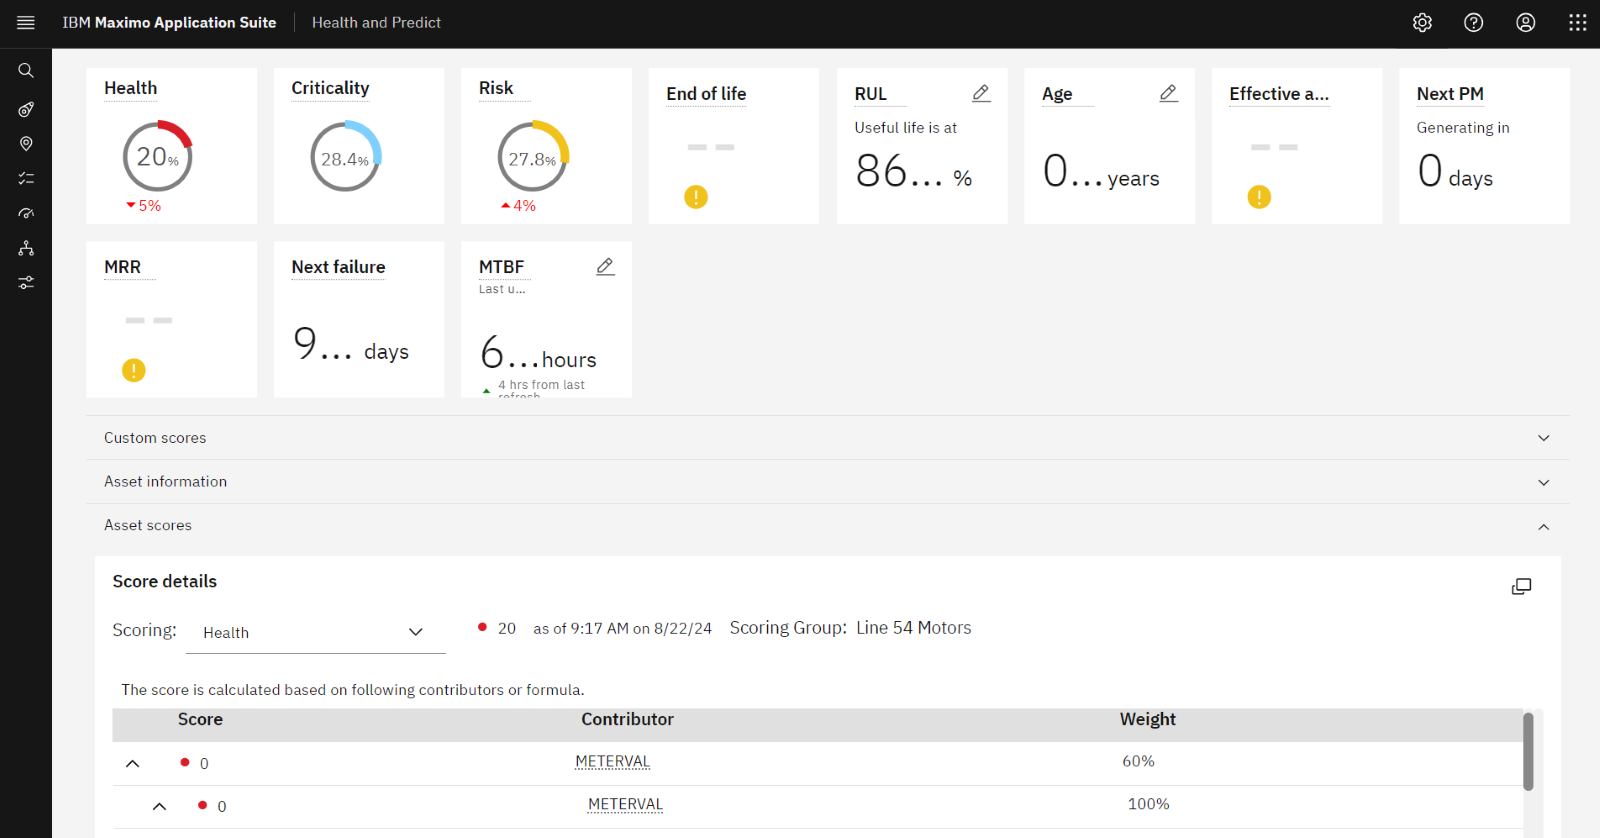
Meter Readings (sensor readings and derived metrics) from Manage and Condition based maintenance thresholds can be used as contributing factors for calculating health, criticality and risk scores.
With that, I will signoff for now. Stay tuned for more on many of the amazing features and functionalities that Maximo Application Suite has to offer.
About Khalid Sayyed
Khalid Sayyed is a Maximo Consultant with over 15 years of industry experience, primarily in IBM Maximo and Cognos analytics. He has worked on multiple Maximo implementations and on support/administration projects, leading teams of developers and consultants. He has extensive experience working with IBM Maximo infrastructure & architecture, integrations, administration, upgrade, configurations, customizations, analytics, and end user/admin trainings. Khalid is very passionate about IOT, Data science and its applications to reliability industry for predictive maintenance.


