Maximo Monitor Anomaly Detection Models

Introduction
Maximo Monitor provides powerful AI-powered machine learning anomaly detection algorithms to find patterns in your time series data that do not conform to expected behavior.
It analyzes historical and real-time data from various sources to detect anomalies, enabling swift action to prevent equipment failures and optimize maintenance.
This capability helps improve equipment reliability, reduce downtime, and enhance operational efficiency. Anomalies are flagged in real-time, allowing for proactive response to potential issues. By detecting anomalies early, organizations can minimize maintenance costs and improve overall asset performance.
Following are the anomaly detection functions, and their use cases provided with Maximo Monitor.
GeneralizedAnomalyScore
The GeneralizedAnomalyScore function applies Minimum Covariance Determinant (MCD) to input data to identify outliers. The function determines the distance of each data point from the center of normally distributed clusters.
Use case:
Scenario in which you monitor the vibration patterns of rotating machinery such as motors, pumps, or turbines. The vibrations of these machines can provide valuable insights into their health and performance. Under normal operating conditions, the vibration patterns typically exhibit certain characteristics, such as periodicity or consistency. However, deviations from these patterns could signal potential mechanical issues or impending failures.
FFTbasedGeneralizedAnomalyScore
The function extracts temporal features from the time series data by using Fast Fourier Transforms (FFT). The function then applies the GeneralizedAnomalyScore function to the features to detect anomalies.
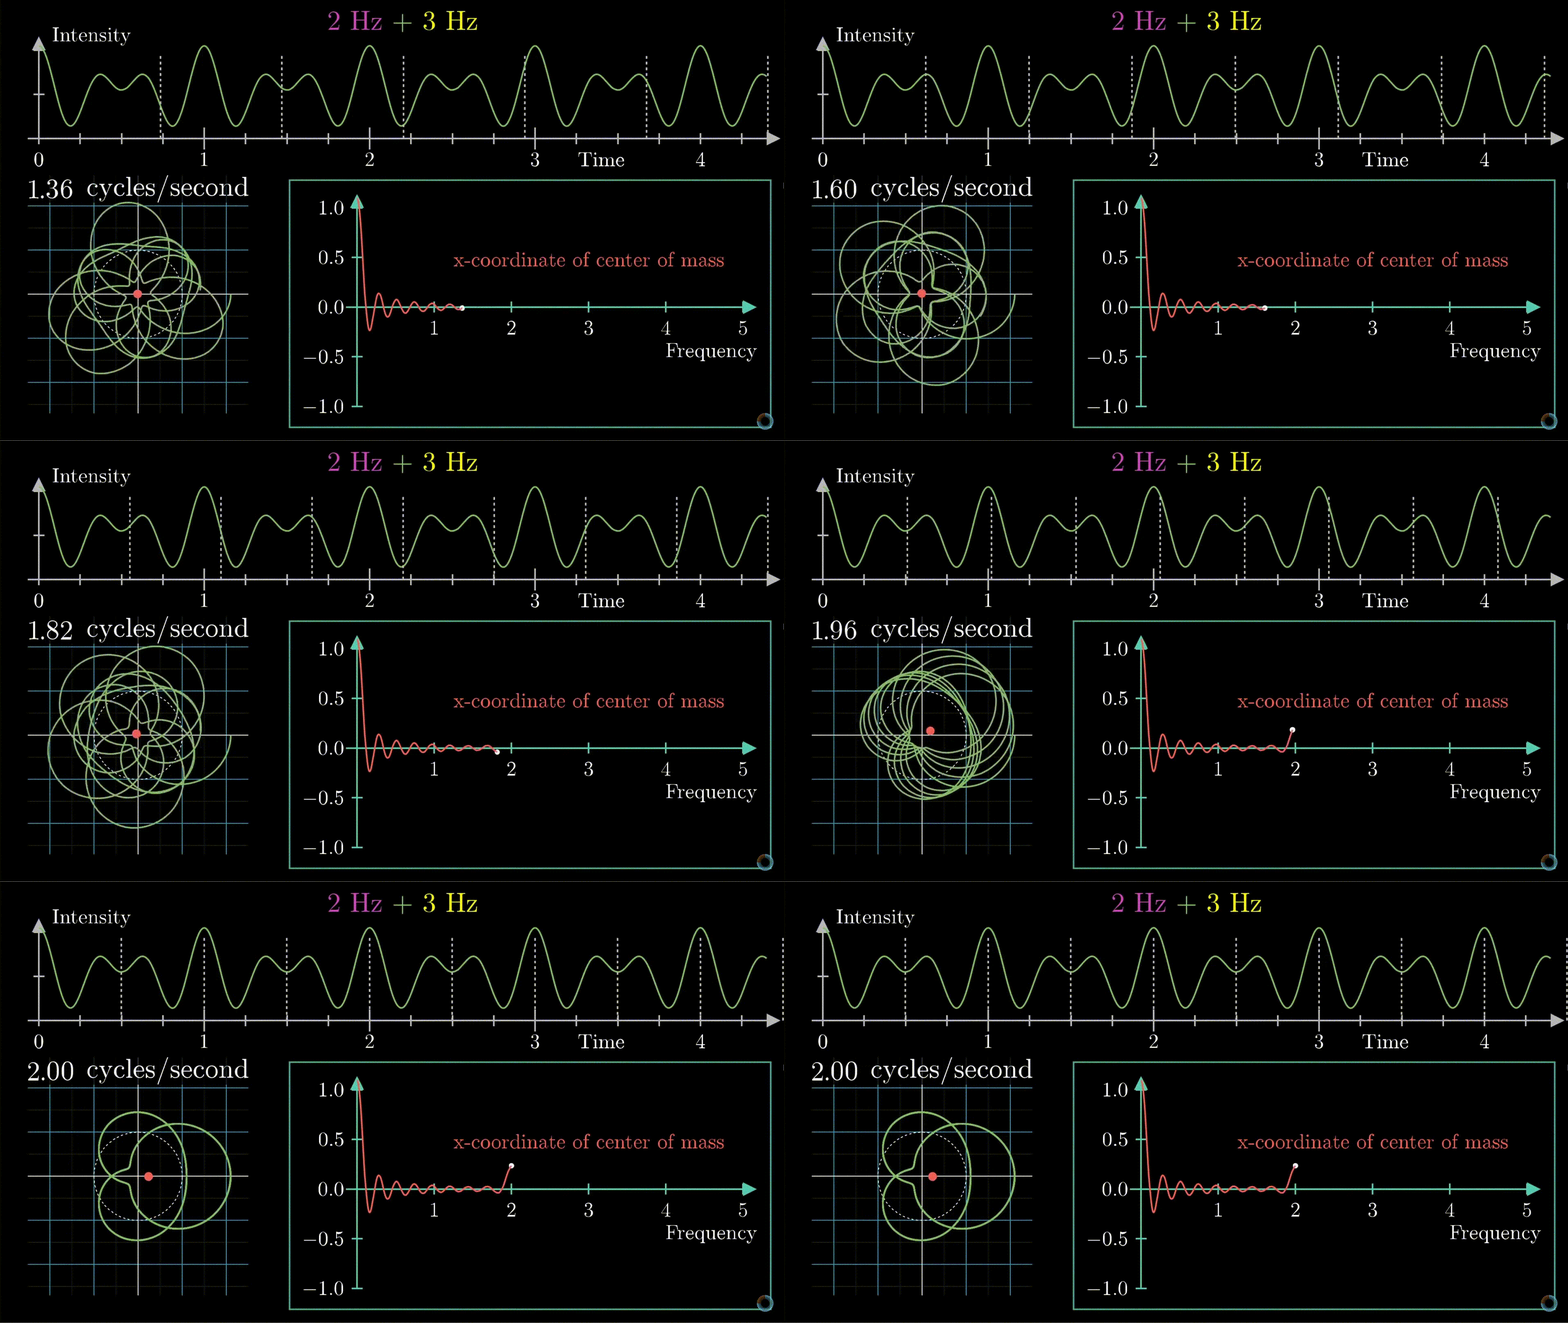
Fourier Transform is a method of identifying pure frequencies within combined frequencies by wrapping the frequency around a circle and plotting the center of mass.
The resulting graph will have peaks at the original pure frequencies.
AA Animation from 3blue1brown
Use this anomaly detection when the resulting metric is due to a combination of factors and anomaly needs to be detected in each of those factors.
Use case:
Fourier Transform-based anomaly detection methods are well-suited for time series data that exhibit periodic or cyclic patterns, as the Fourier Transform can decompose signals into their constituent frequencies. An example of such data is in the field of energy consumption monitoring, particularly in electricity consumption data.
In this scenario, consider a dataset containing hourly or daily electricity consumption readings from a smart meter installed in a residential or commercial building. The data typically exhibits periodic patterns due to daily and weekly cycles, such as higher consumption during daytime hours and lower consumption at night, as well as fluctuations based on weekdays versus weekends.
The Fourier Transform is applied to the preprocessed time series data to decompose it into its constituent frequencies. This reveals the dominant periodic components present in the data. Also, highlighting anomalies.
Anomalies in the electricity consumption data can be detected by examining deviations from the expected patterns in the frequency domain. Anomalies may manifest as unexpected spikes or drops in certain frequency components, indicating abnormal consumption patterns.
MatrixProfileAnomalyScore
The MatrixProfileAnomalyScore function applies a matrix profiling technique to input time series data. To perform matrix profile analysis, the data is broken down into smaller subsets using a sliding window. The size of each subset is the same as the length of the sliding window. The function produces a distance matrix that is called a matrix profile. To produce the matrix profile, the function computes the pairwise Euclidean distance between each subset of data and its closest subset of data from all possible subsets. A high matrix profile score indicates that subset is different from all other subsets and is an anomaly.
Use case:
Unusual patterns in sensor readings at different times (example under peak load or during a particular time of the day).
Might indicate unusual behavior under certain condition/times.
Saliencybased GeneralizedAnomalyScore
Salient region detection is a computer vision technique used to identify and extract the most visually prominent or relevant parts of an image.
Similar to image data, in time series data, salient regions could correspond to specific time intervals or segments that exhibit unusual behavior. These could be periods of high volatility, sudden spikes, or recurring patterns that stand out from the rest of the data.
Once salient regions are identified, relevant features are extracted from these regions to capture their characteristics. These features could include statistical measures such as mean, variance, skewness, or more complex features derived from signal processing techniques.
Anomaly detection algorithms are then applied to the extracted features to identify deviations from normal behavior.
Use case:
Consider a scenario where sensors are collecting time series data from various components of a manufacturing plant, such as temperature, pressure, and energy consumption. The goal is to detect anomalies that could indicate potential faults or failures in the machinery, allowing for timely maintenance to prevent costly downtime.
In this context, salient region detection can be applied to identify periods of time where significant deviations from normal operating conditions occur. These deviations could manifest as sudden spikes or drops in sensor readings, irregular patterns, or unusual combinations of sensor values.
NoDataAnomalyScore
This is used to identify unusual gaps withing the data.
The NoDataAnomalyScore function prepares the data by turning the gaps into values. The larger the gap, the higher the value. Next, the prepared data is passed to the GeneralizedAnomalyScore.
The function is useful for detecting gaps or missing data in a data set. The function works best when the gaps in the data are large and when they occur over long periods of time.
Use case:
Consider a scenario where various sensors are deployed to monitor the performance of critical assets, such as pressure sensors in pipelines. The absence of data from these sensors, when it's expected to be present, can indicate malfunctioning equipment, sensor failures, or communication issues.
SpectralAnomalyScore

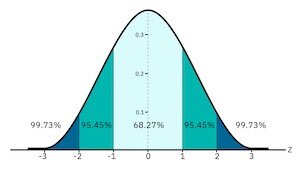
Calculates the z-score in a normal distribution of the data to understand how far the data point is from the mean.
Spectral anomaly-based anomaly detection methods are well-suited for time series data in predictive maintenance scenarios where anomalies manifest as abnormal spectral patterns or frequency components in the data.
Use case:
An example of such data can be found in the monitoring of acoustic signals from rotating machinery, such as motors, pumps, or turbines.
In this scenario, acoustic emissions from rotating machinery contain valuable information about the health and condition of the equipment.
Under normal operating conditions, the acoustic signals exhibit certain spectral characteristics, such as dominant frequencies or harmonic patterns, which can be analyzed to detect anomalies indicative of mechanical faults or impending failures.
KMeansAnomalyScore
Performs K-means analysis on your time series data to detect anomalies.
K-means analysis is a clustering technique that separates your data into clusters. In each cluster, the mean value converges towards the center of the cluster.
Data points are allocated to clusters based on their proximity to the mean, or centroid.
Use case:
K-means anomaly-based anomaly detection methods are well-suited for time series data in predictive maintenance scenarios where anomalies manifest as distinct clusters or patterns that deviate from the norm. An example of such data can be found in the monitoring of temperature or pressure readings from industrial equipment, such as boilers, HVAC systems, or chemical reactors.
In this scenario, temperature or pressure readings are continuously monitored to ensure optimal operating conditions and prevent equipment failures or safety hazards. Anomalies in these readings could indicate malfunctions, leaks, or other abnormal conditions that require immediate attention.
For more details on this work we have done with MAS Monitor, we invite you to join our session at Maximo World 2024 in Phoenix, where we will be co-presenting with Morgan Foods on August 6 at 3:15 pm MST. We'll discuss Morgan Food’s experience in expanding the Maximo Application Suite (MAS) into monitoring and predictive capabilities. If you're considering registering for Maximo World 2024, please visit https://web.cvent.com/event/8ef9023b-24c3-4721-b2dd-9740badc1f58/regProcessStep1.
About Khalid Sayyed
Khalid Sayyed is a Maximo Consultant with over 15 years of industry experience, primarily in IBM Maximo and Cognos analytics. He has worked on multiple Maximo implementations and on support/administration projects, leading teams of developers and consultants. He has extensive experience working with IBM Maximo infrastructure & architecture, integrations, administration, upgrade, configurations, customizations, analytics, and end user/admin trainings. Khalid is very passionate about IOT, Data science and its applications to reliability industry for predictive maintenance.


