Maximo Application Suite Health - Setting Scores

Setting Health, Criticality, and Risk Scores in MAS Health
Maximo Application Suite 8 (MAS) offers many new features to Maximo users. Among the most powerful and useful of these new features is the new Health Application, which provides an all-new way of managing your Assets and understanding which Assets might need to be addressed with work.
One of the most common questions about the Health Application is “Where do the Scores come from?”, which can be put in another way… “What do the Scores mean?” The answer is deceptively simple: whatever you need them to mean. Since not all assets are alike, there isn’t one standard answer that is used for all assets. Each of the Health, Criticality, and Risk scores shows on a scale of 0 to 100 the calculated value determined for that score by the score contributors that you have determined are appropriate for it. These scores can take into account fields from your Maximo system, meter readings, and complex calculations as multiple factors that together generate a single score for each of Health, Criticality, and Risk. The way the scores are calculated can also be different for different groups of assets, allowing a great deal of flexibility in the way these are set up. Given that flexibility it can be a bit daunting to tackle setting up the scores, but in reality, it is relatively easy once you understand the process.

Here's how it works.
1. Create a group of assets to be scored together. This is done very easily by creating a query in MAS Manage (what used to be known as Maximo) in the Assets application. Use the filtering on the Asset List tab to generate your list of Assets and then save the query.
2. In MAS Health, open the Scoring Application. Hit the Blue “Create group +” button to create a
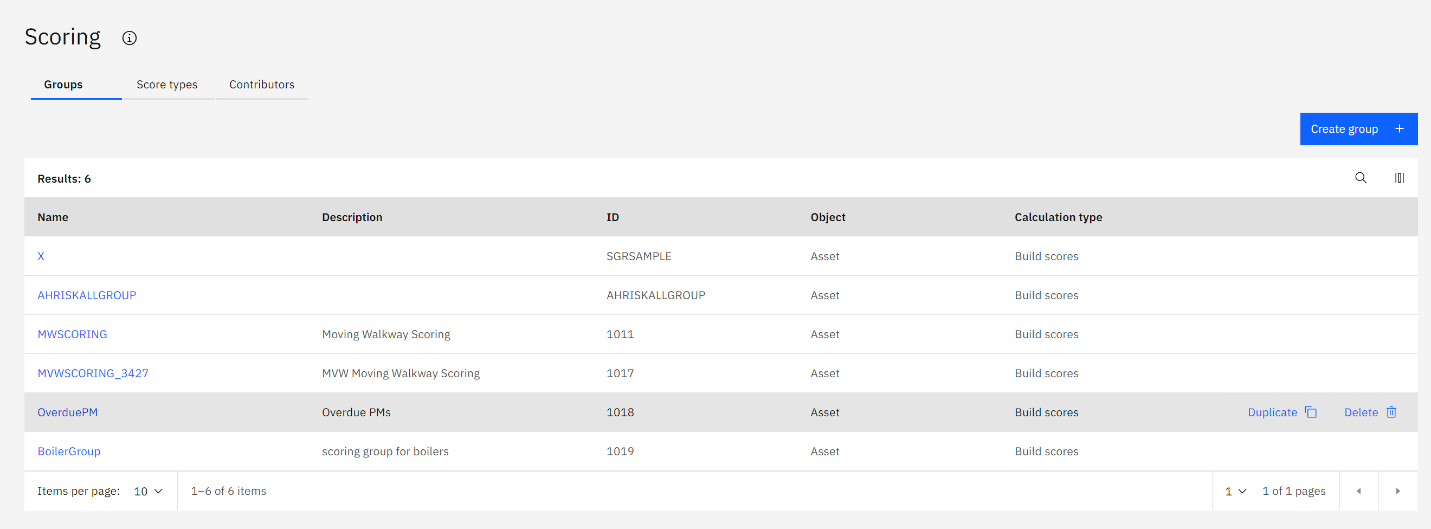
new asset group. In the next screen give your group a name and description, and choose
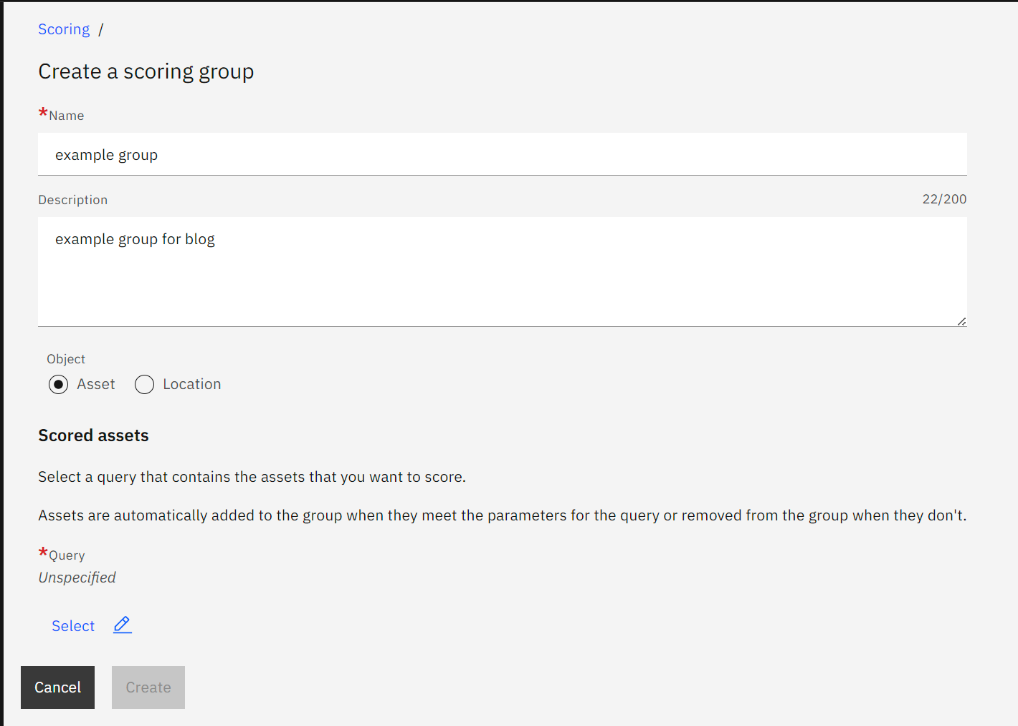
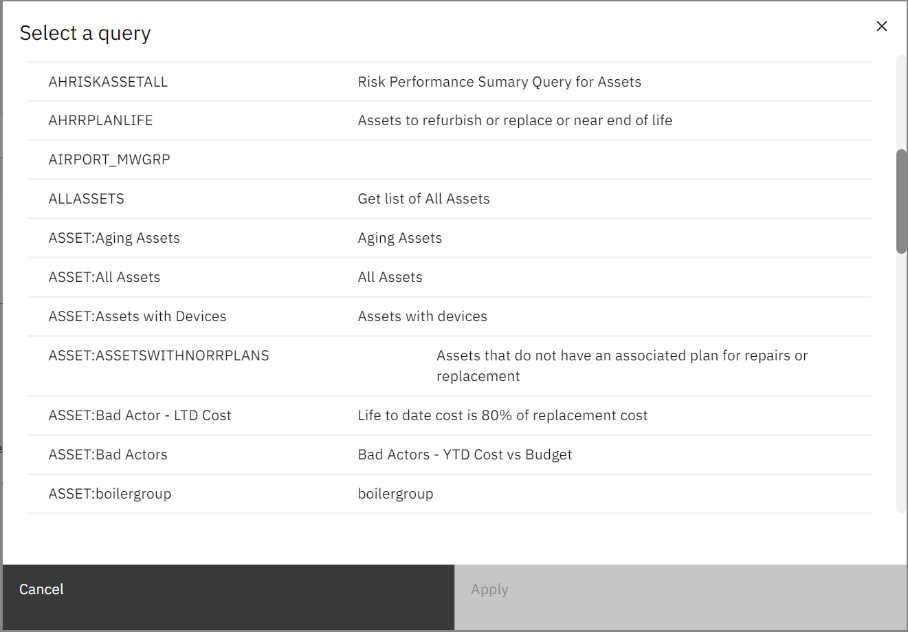
whether you are selecting from Assets or Locations. Then, under “query” press the button for “select” and pick your saved query from step 1 above. Click “Apply” to apply the query and then “Create” to create the group.
3. In the “Scores” section, press the blue “Add Score” button to create a new score. Let’s pick “Health” from the tiles on the next screen, and we will begin creating the contributors to our
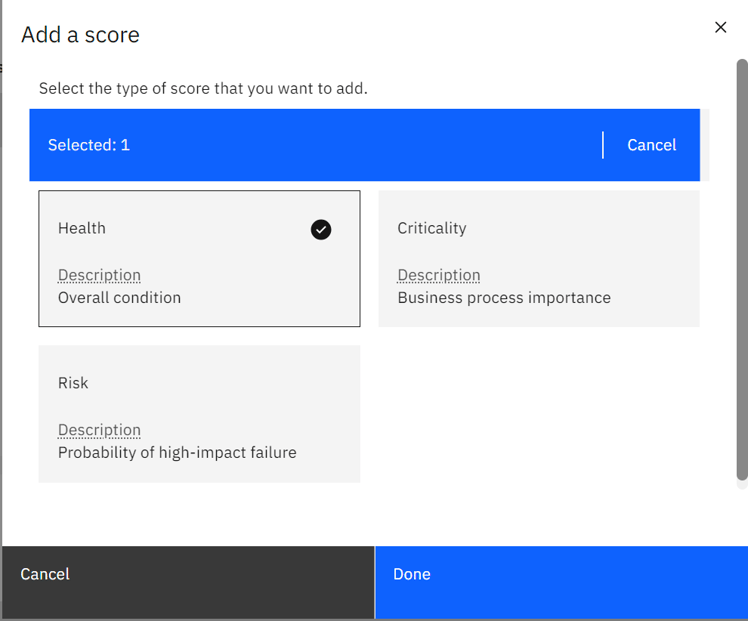
health score. Contributors are the different component scores that are aggregated to make up the Health score; you can have many different contributors, and they are combined together to generate the overall score.
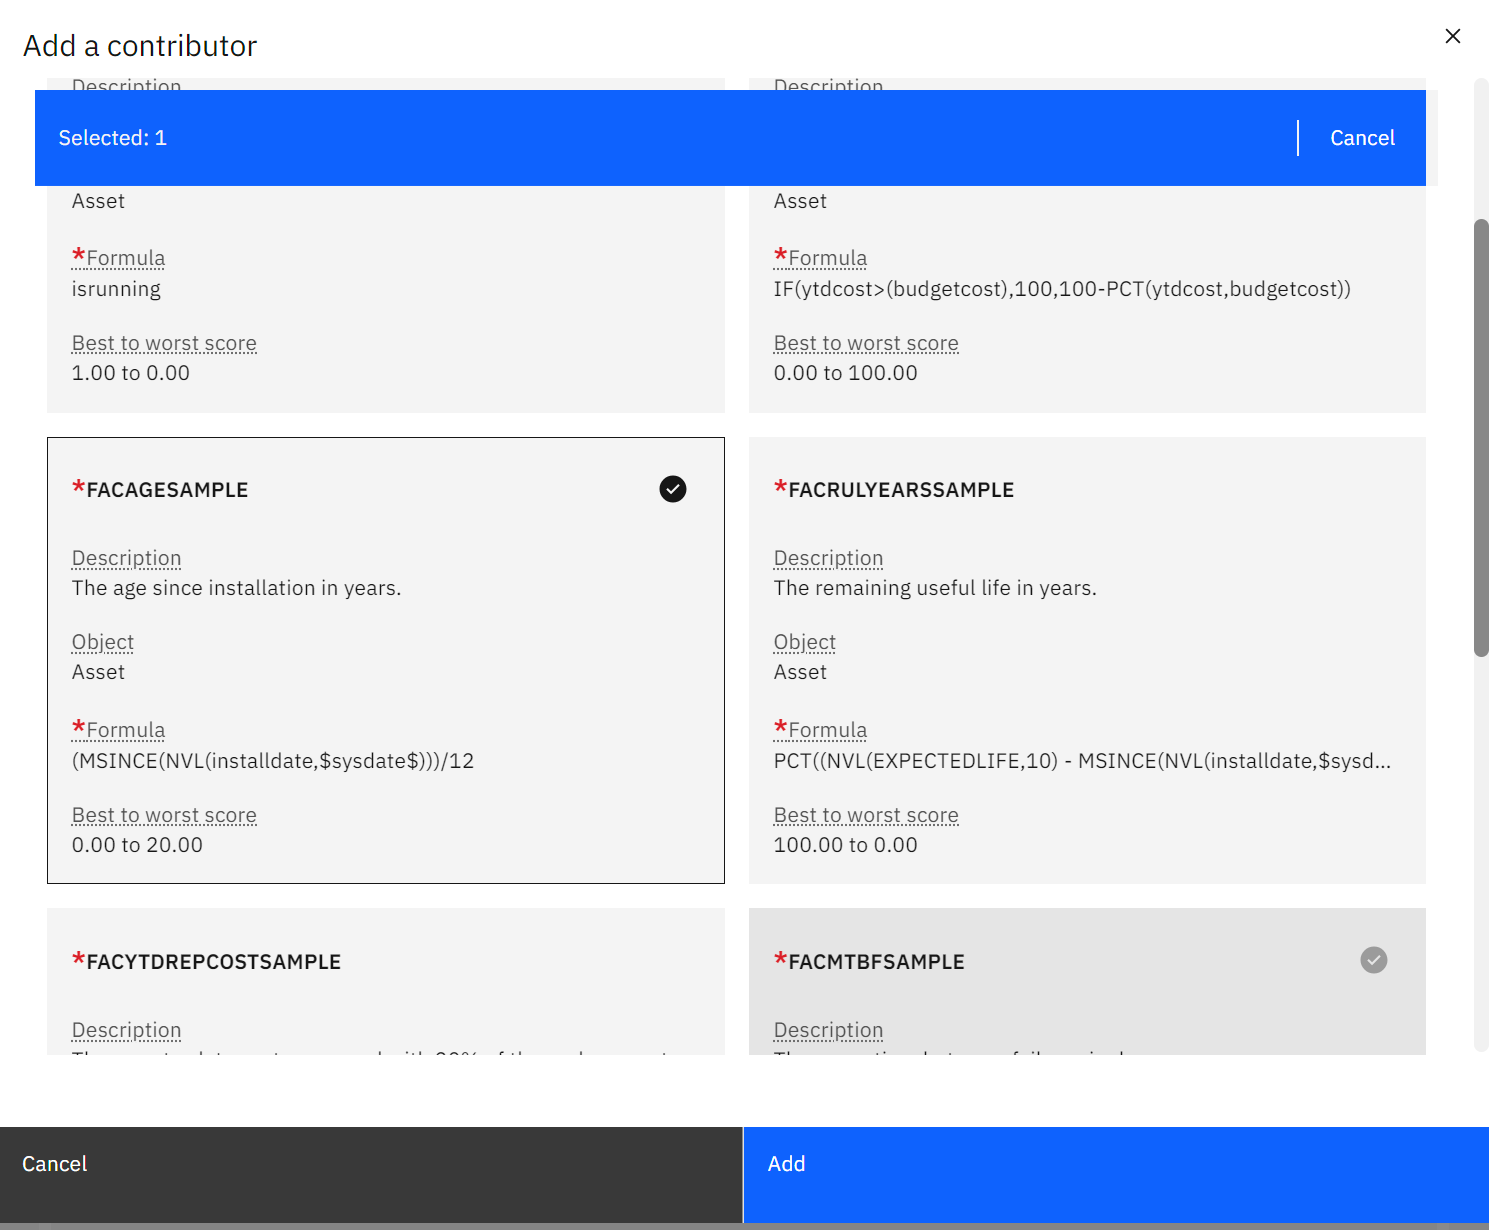
4. In the contributors section press the “+” button to bring up the list of existing contributors that have been defined. MAS Health comes with at least a few basic contributors that we can build from. These samples also give an introduction to the way in which the query formulas can be created. The samples are:
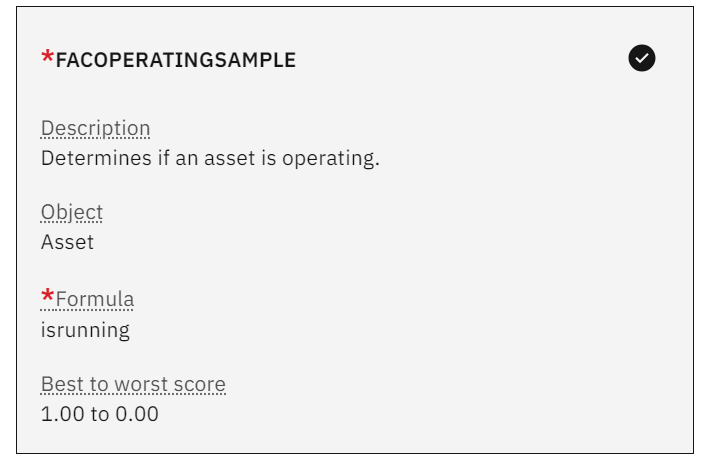
a. FACOPERATINGSAMPLE – a simple check on the “isrunning” field in Manage to see if the asset is running
b. FACYTDBGTCOSTSAMPLE – a formula that returns the percentage of the yearly budget for the asset that has been spent
c. FACAGESAMPLE – a formula that checks the age since the asset has been installed
d. FACRULYEARSSAMPLE – a formula that checks how much of the expected life of the asset remains based on the “expectedlife” field and the “installdate” field
e. FACYTDREPCOSTSAMPLE – a formula that compares the year-to-date cost for the asset with 20% of the replacement cost of the asset
f. FACMTBFSAMPLE – a formula that finds the mean time between failures for the asset based on work orders
g. All of these are potentially useful as components of the health score for an asset. You can also create your own contributors based on meters, fields, and your own formulas. This will be covered in a future blog post. As part of an implementation of MAS Health this will be an important conversation to take place for each type of score for each grouping of assets.
5. For now, select the FACAGESAMPLE contributor, and press “Add” to add it as a contributor.
6. Repeat the steps above to add a second contributor. This time choose the FACOPERATINGSAMPLE
7. After adding your contributors there are two more steps to complete before you can start getting your score generated. First you have to determine the weight to be placed on each contributor for generating the overall score. To do this, in the Contributors section press the
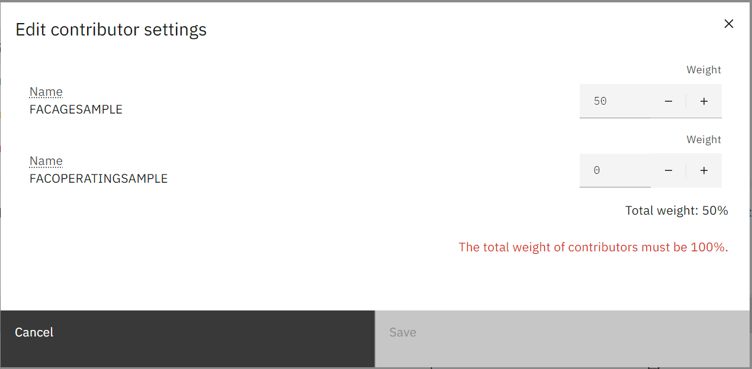
pencil icon to bring up the “Edit contributor settings” dialog. Here you need to add the percentage weight to be put on each of the contributors. The weights entered for all your contributors must add up to 100%. For this example enter 50 for each of the two contributors to show an even split between them in determining the Health score. Like the contributors to be used, the split percentage will be determined as part of your implementation of MAS Health. When you are done, press Save to save and exit the “Edit contributor settings” box.
8. Finally to start using the score you must activate the Health score, which is done my moving the slider in the top right corner labeled “Active” from NO ![]() to YES
to YES![]() . When you do this the health scores will be generated for all of your assets in the asset group, and you will start seeing the score populated throughout MAS Health.
. When you do this the health scores will be generated for all of your assets in the asset group, and you will start seeing the score populated throughout MAS Health.
Congratulations, you have learned the basics of setting a score in MAS Health!

Similar steps can be taken to create both the Risk and the Criticality scores for your assets!
About James Kanuch
James Kanuch is a Sr. Solutions Architect with Interloc, and has been working as a consultant with Maximo since 2005. He has extensive experience working in the Utilities, Transportation, Automotive, Life Sciences, Manufacturing and other industries, developing solutions to Work Management, Supply Chain Management, and Asset Management needs for more than 20 years. His current focal areas are on the new features and applications available in the Maximo Application Suite and helping clients take advantage of the new tools when they upgrade to MAS, and on developing new projects for clients.


