By: Greg Dukelow on May 5th, 2011
Demystifying remote Maximo debugging
Maximo | Interloc Solutions | Java | WebSphere | Debug | WebLogic | Eclipse
Updated: April 6, 2020 by Jeff Kish
Many implementations of Maximo include a good bit of custom written Java code. When the code works, life is great and everyone is happy. However, as most of us know, that is not often the case, and then you are stuck searching log files for debug statements.
Free yourself from those seemingly endless searches! This post shows you step by step just how easy it is to set up a remote debug environment using IBM WebSphere.
Learn how to step through code execution within an IDE (such as Eclipse) for code that is running on the server in real time, eliminating the need for coding or reading tedious Maximo log files.
Note: This has been tested with WebSphere 8.5.x and 9.x, Eclipse 4.x and IBM Maximo 7 While the general steps should work with other versions, only these versions have been tested.
Configuring WebSphere
Open a browser and navigate to the IBM WebSphere administrator console. 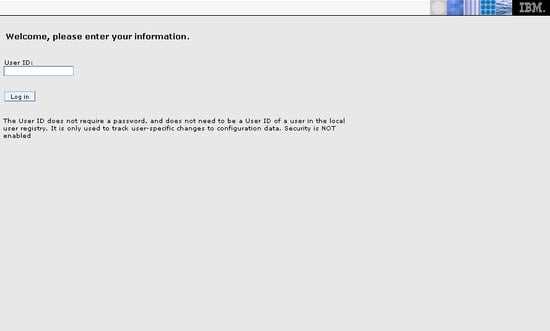
Enter a User ID and if required a password, and click the Log In button.
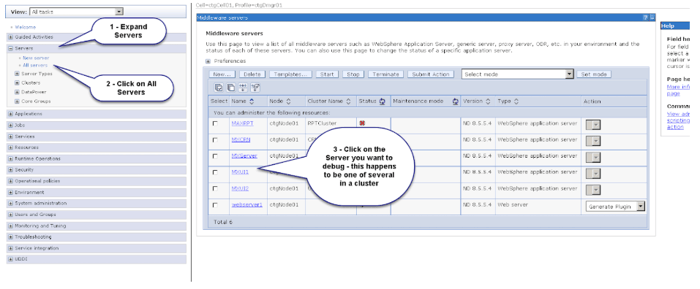
From the navigation menu on the left side of the screen click the + button to expand the “Servers” section. Click on the “Application servers” link found under the “Servers” section. Finally, click the MAXIMOSERVER (Note: Your server may be named differently) link to view the Maximo application server details.
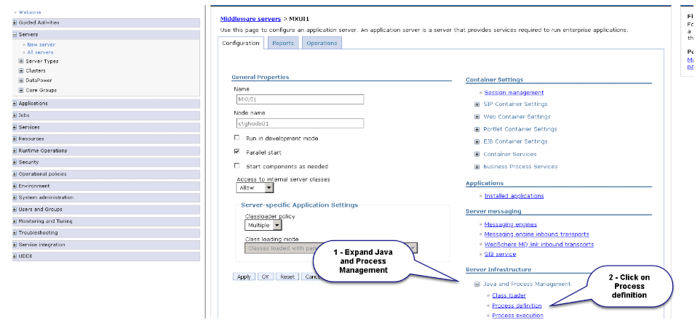
Click the + next to the “Java Process and Management” link and then click the “Process Definition” link to view the Java process details.
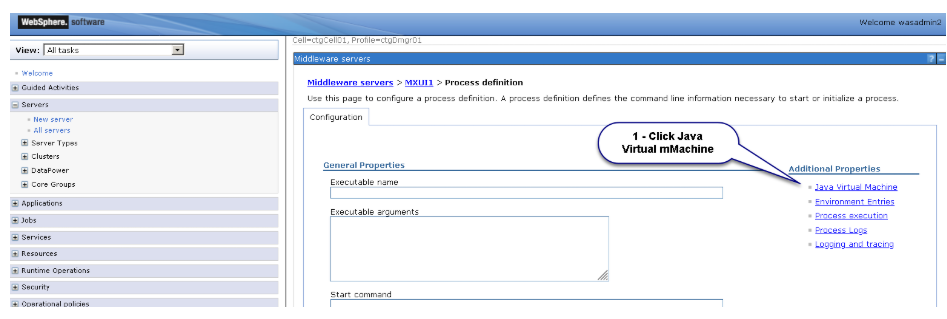
Click the “Java Virtual Machine” link under the “Additional Properties” heading.
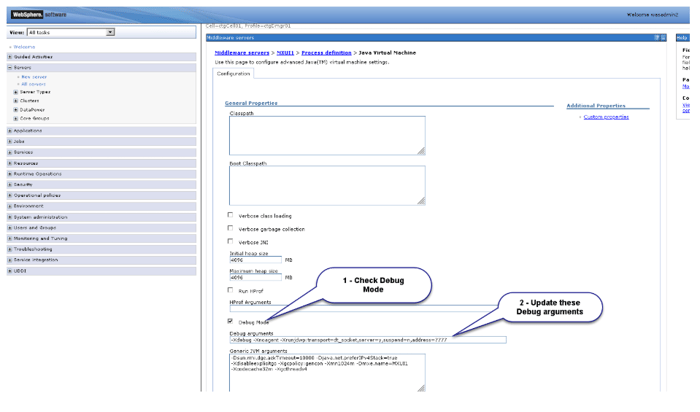
Near the bottom of the screen there is a checkbox for “Debug;" ensure that this checkbox is checked.
In the “Debug arguments” field, enter the following value as a single line:
-Xdebug -Xnoagent
-Xrunjdwp:transport=dt_socket,server=y,suspend=n,address=7777
Important: The address is specified as port 7777 for the debug port. You may change this value, but the rest of this document assumes that port 7777 was the selected port.
Configuring Eclipse
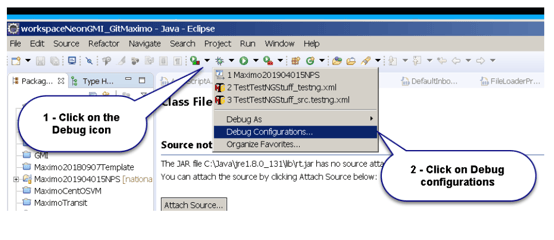
Open Eclipse. From the debug menu; select the “Open Debug Dialog” menu option.
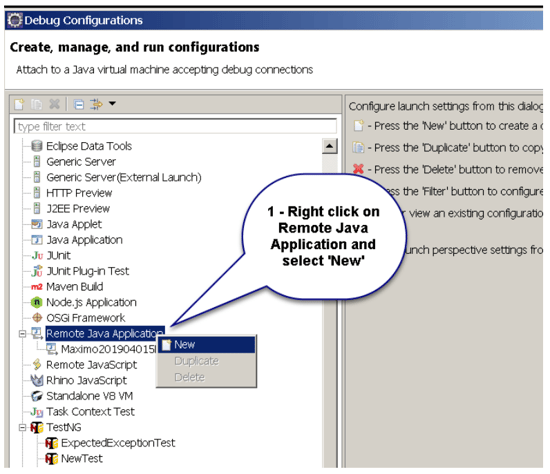
From the list selection, select “Remote Java Application” and then click the New icon, as indicated below:
In the "Name" field, enter a debug profile name, this can be any name you choose, but something such as “Maximo Debug” works well.
In the "Project" field, enter or select the current project name. In the "Host Name" field, enter the name of the server that is running WebSphere.
In the "Port" field, enter the debug port specified when configuring the WebSphere application server, typically this is 7777.
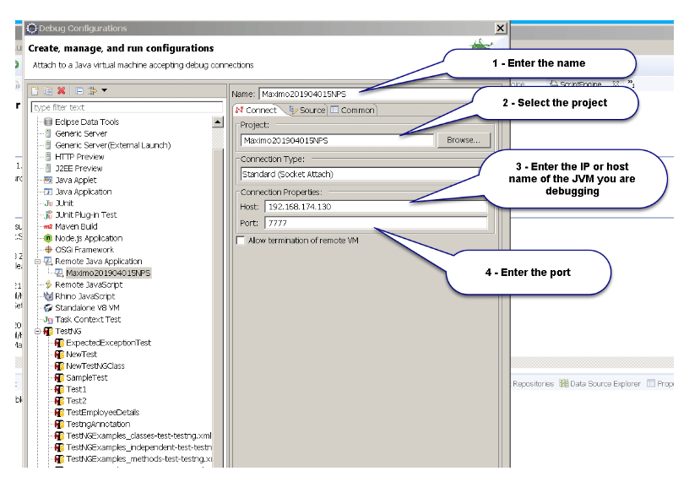
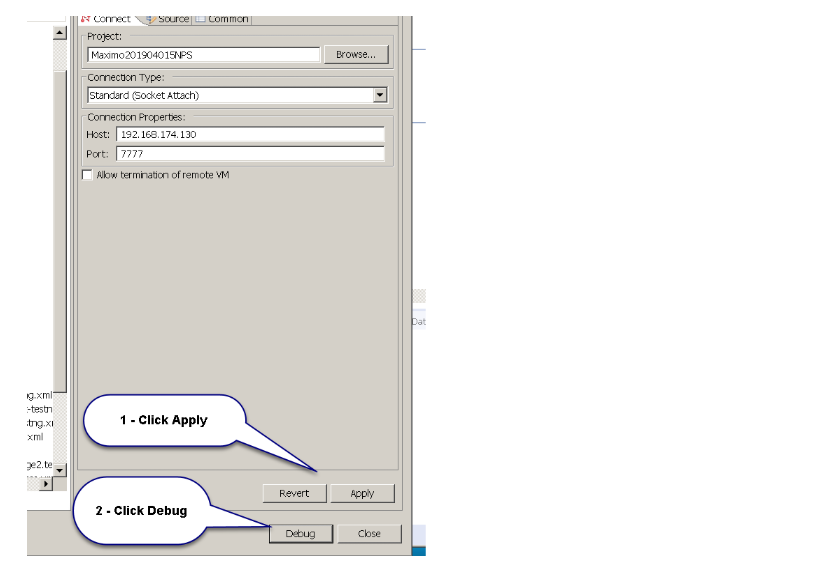
Clink the "Apply" button, and then, if you wish to start debugging and Maximo is running on WebSphere, click the "Debug" button to start the debug process.
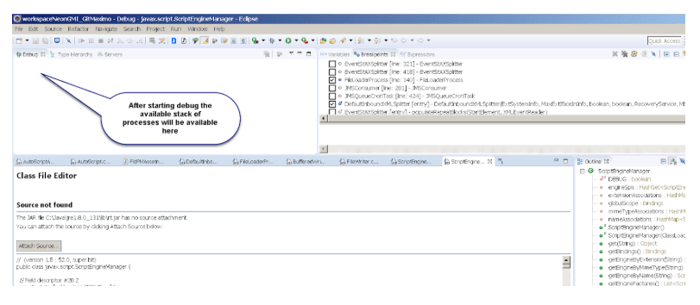
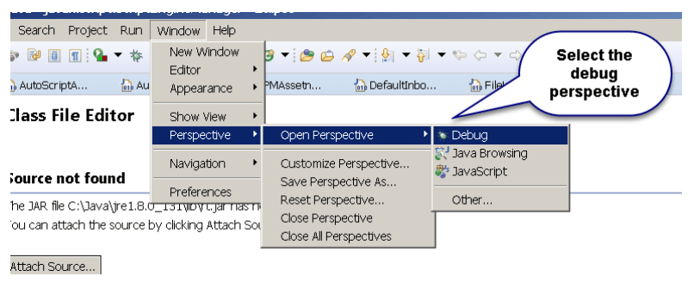
Eclipse contains a debug perspective that provides access to the JVM process information and menus catered to debugging. While you may be prompted by Eclipse to open this perspective, it may be manually accessed by selecting the "Window > Open Perspective > Other …" and from there select the "Debug" perspective.
Summary
You are now set up for remote debugging; enabling a smoother route for debugging. Let us know if this works for you!
Do you have an alternate way or another time-saver? Share it with our readers!

